
Welcome to
Azur Electronics
Azur Electronics
Home
Projects
Test Equipment
- Accessories
- Adaptors
- Amplifiers
- Attenuators
- Cables
- Frequency Counters
- Logic Analysers
- Multi-Meters
- Network Analysers
- Oscilloscopes
- Power Meters
- Power Supplies
- Prototyping Equipment
- Signal Generators
- Spectrum Analysers
- Tools
Operating Information
- Operating HP 141T
- Operating HP 1630D
- Operating HP 8175A
- Operating HP 8407A
- Operating HP 8410C
- Operating HP 8552B IF Section
- Operating HP 8553B RF Section
- Operating HP 8554B RF Section
- Operating HP 8555A RF Section
- Operating HP 8556A LF Section
- Operating HP 8594E Spectrum Analyser
- Operating HP 8901B
- Operating LeCroy 9310
Technical
- Allen Key Sizes
- High Voltage Measurement
- HP Cases
- HP Information
- HP-IB Interface Bus
- Measurement Units
- Motorola ECL
- RF Connectors
- RF Power - Voltage Conversion
For Sale
Wanted
Links
About Me
Contact Me
Site Map
OPERATING HP 8556A
LF SECTION
LF SECTION
CALIBRATION
Before the Spectrum Analyser can be used, it must be calibrated using the following procedure. This sets the HP 8552B IF Section X & Y gain & position and the HP 8556A LF Section amplitude calibration.
[Based on HP 8552B & 8556A Operating and Service Manuals]
Before the Spectrum Analyser can be used, it must be calibrated using the following procedure. This sets the HP 8552B IF Section X & Y gain & position and the HP 8556A LF Section amplitude calibration.
[Based on HP 8552B & 8556A Operating and Service Manuals]

NOTE: Ensure the 8552B / 8556A D-type connectors are correctly mated.
Poor mating is often the cause of X & Y display problems! A quick check is to ensure that switching the INPUT ATTENUATION lights all the lamps around the LOG REF LEVEL control.
1. Initial Setup
Switch the HP 141T Display Section LINE ON.
Press NON STORAGE mode CONV button.
Intensity to 12 o’clock approx.
Focus to 12 o’clock approx.
Allow to warm up for 30 minutes approx.
Set 8556A Controls as follows:
RANGE 0 - 300kHz
FREQUENCY 150kHz
FINE TUNE Centred
BANDWIDTH 10kHz
SCAN WIDTH PER DIVISION
PER DIVISION 20kHz
INPUT ATTENUATION -20dBm/dBV
20kHz MARKERS Out
TRACKING GEN LEVEL Cal
Set 8552B Controls as follows:
MANUAL SCAN Centred
BASELINE CLIPPER CCW
SCAN TIME PER DIVISION 5ms
LOG REF LEVEL -10dBV (Red Scale)
LOG REF LEVEL Vernier 0
LOG LINEAR 10dB LOG
VIDEO FILTER OFF
SCAN MODE INT
SCAN TRIGGER AUTO
2. Focus and Astigmatism
Adjust INTENSITY as needed.
Set LOG REF LEVEL maximum CCW (this minimises noise on the baseline).
Adjust VERTICAL POSITION to set the trace to the -50dB graticule line.
Set SCAN TIME PER DIVISION to 10s.
Adjust FOCUS and ASTIG for the smallest round dot possible.
3. Trace Alignment
Set SCAN TIME PER DIVISION to 5ms.
Adjust TRACE ALIGN to set the trace parallel to the horizontal graticule line.
4. Horizontal Position and Gain
Adjust HORIZONTAL POSITION so the display is centred on the CRT.
Adjust HORIZONTAL GAIN so the displayed scan width is exactly 10 divisions on the CRT.
Some interaction between HORIZONTAL POSITION and GAIN controls may require readjustment.
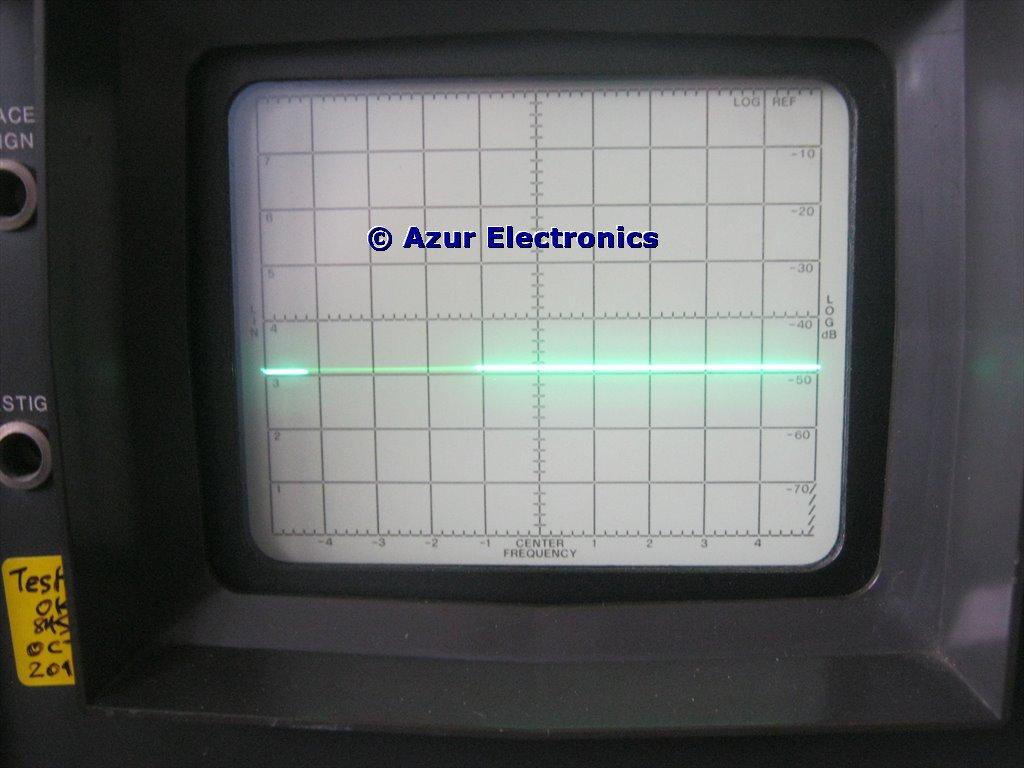
Display shows horizontal line at -50dBm graticule line
5. Vertical Position and Gain
Adjust VERTICAL POSITION to set the trace to the -80dB graticule line.
Connect TRACKING GEN OUT OUTPUT to INPUT using a BNC to BNC 50Ω coax cable. Do not use a feedthrough termination.
Set VIDEO FILTER to 10kHz.
Set LOG REF LEVEL VERNIER to set the trace to the -70dB graticule line. Adjust AMPL CAL if necessary to lower trace.
Rotate LOG REF LEVEL 7 steps clockwise. The amplitude of the signal should increase one vertical division per 10dB step.
Adjust VERTICAL GAIN to place maximum signal amplitude exactly on the top graticule line.
Repeat the previous 3 steps to obtain optimum setting.
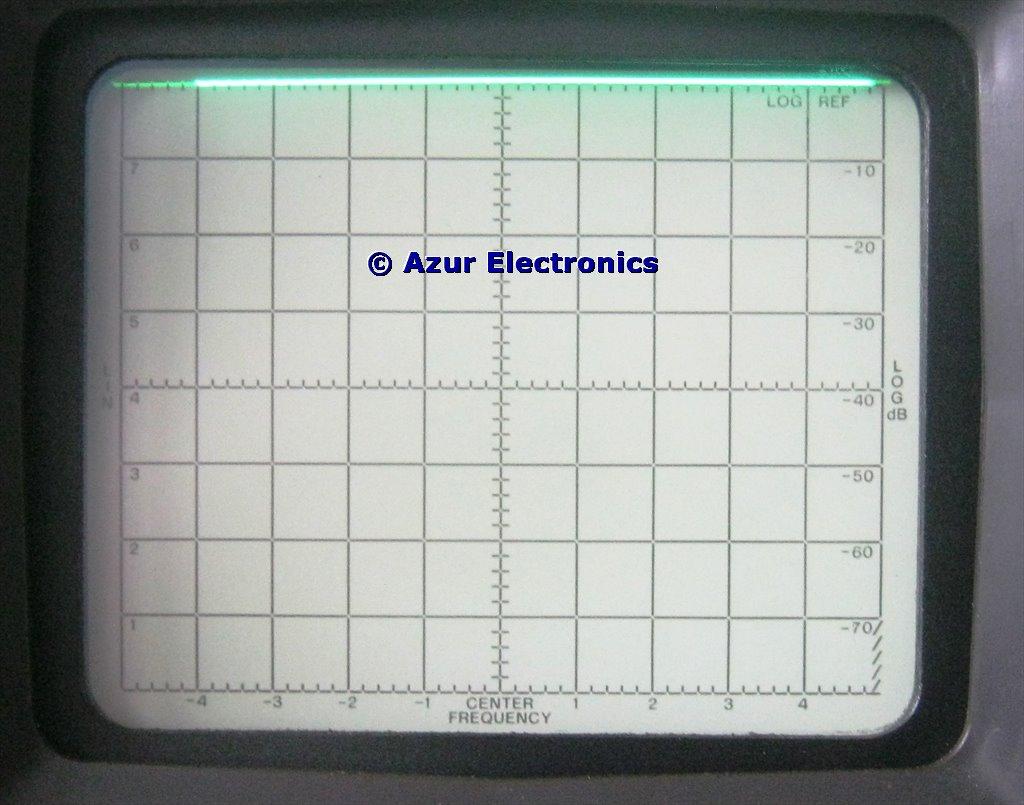
Display shows horizontal line at 0dBm top graticule line
6. Amplitude Calibration
Set LOG REF LEVEL to -20dBV (Red Scale).
Set LOG REF LEVEL VERNIER to 0.
Adjust AMPL CAL to place the signal amplitude exactly on the top graticule line.
The Spectrum Analyser is now calibrated in the LOG display mode from -92dBm/dBV to +10dBm/dBV.
7. Linear Mode
Set LOG REF LEVEL to 20mV/DIV (Green Scale).
Set the LOG – LINEAR switch to LINEAR.
Adjust AMPL CAL to place the signal amplitude exactly on the fifth graticule line (5 x 20mV = 100mV).

Display shows horizontal line at 5th graticule line
The left hand side vertical graduations 0 to 8 are calibrated in absolute voltage.
The Spectrum Analyser is now calibrated in the LINEAR display mode from 0.1µV to 1V.
8. Tracking Adjustment
Set the LOG – LINEAR switch to 10dB LOG.
Set the LOG REF LEVEL to -10dBV (Red Scale).
Set the SCAN WIDTH to Zero.
Reduce the BANDWIDTH to 10Hz.
Adjust TRACK ADJUST to bring the trace as high as possible on the display.
Set the LOG – LINEAR switch to 2dB LOG or LINEAR.
Repeat the TRACK ADJUST peaking procedure.
Return the LOG - LINEAR Switch to 10dB LOG.
9. Frequency Calibration
Disconnect TRACKING GEN OUT OUTPUT from the INPUT.
Set 8556A Controls as follows:
RANGE to 0 - 30kHz.
FREQUENCY 0kHz.
FINE TUNE Centred.
BANDWIDTH 300Hz.
SCAN WIDTH PER DIVISION
PER DIVISION 1kHz
20kHz MARKERS In.
Set 8552B Controls as follows:
SCAN TIME PER DIVISION 50ms
VIDEO FILTER OFF
The FREQUENCY dial should be at 0kHz.
Adjust ZERO ADJ for Local Oscillator feedthrough signal at the centre frequency graticule on the display.
Set RANGE to 0 - 300kHz.
Slowly tune FREQUENCY to 300kHz, counting 20kHz markers as they pass the centre frequency graticule on the display.
Adjust 300kHz ADJ so that the FREQUENCY dial is at 300kHz when the fifteenth marker is centred.
Repeat the last steps until no more adjustment of ZERO ADJ and 300kHz ADJ is required.
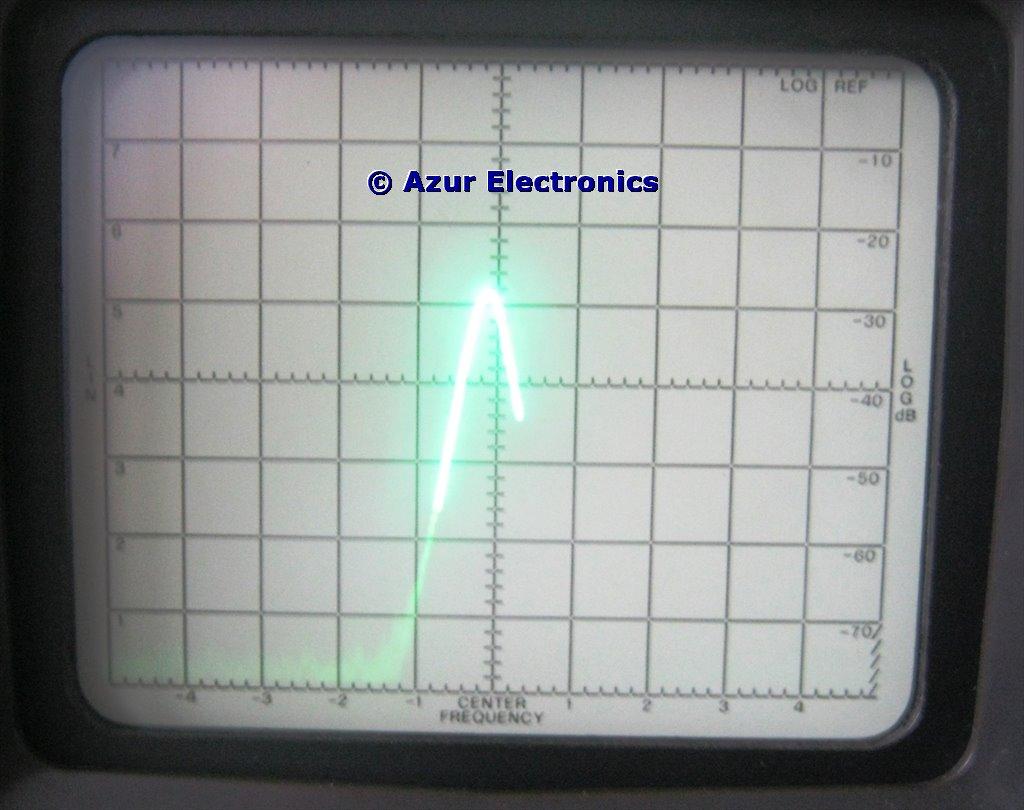
Display shows centred L.O. feedthrough signal at 0kHz
Tricky to photograph at 50ms!
Tricky to photograph at 50ms!
10. Reset
Return the 8552B and 8556A controls to their starting position.
NOTE: For safe operation, maximum LF Input level is 10Vrms, ±200Vdc.
Ground terminals of BNC input connectors are isolated from analyser chassis ground to minimise ground loop pickup at low frequecies. To avoid damage to the Mixer, initially utilise maximum input attenuation and/or an external attenuator!
August 2019
Have now sold all my 141T based equipment.
Have now sold all my 141T based equipment.